Day 7: Building Your First End-to-End Log Processing Pipeline
Day 7: Building Your First End-to-End Log Processing Pipeline
What We’re Building Today
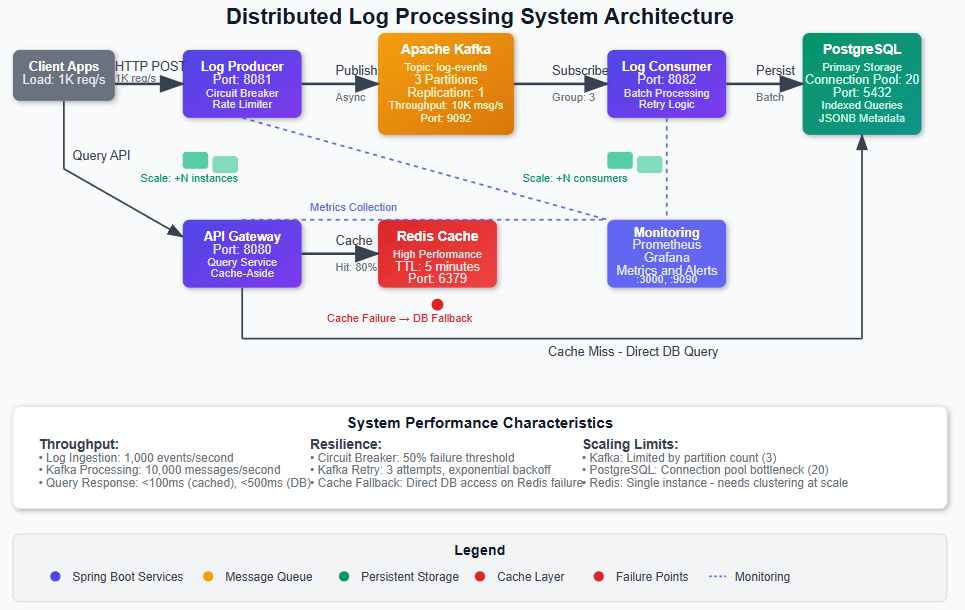
> Today marks a critical milestone in our distributed systems journey. We’re integrating all the components we’ve built over the past week into a complete, production-ready log processing pipeline that runs on a single machine but follows distributed system principles. By the end of this lesson, you’ll have:
> • A multi-service Spring Boot system with log producers, consumers, and a query API gateway • Event-driven architecture using Apache Kafka for reliable message delivery and decoupling • Persistent storage layer with PostgreSQL for long-term log retention and Redis for high-performance caching • Production observability with Prometheus metrics, distributed tracing, and Grafana dashboards
[
](https://substackcdn.com/image/fetch/$s!1-cL!,fauto,qauto:good,flprogressive:steep/https%3A%2F%2Fsubstack-post-media.s3.amazonaws.com%2Fpublic%2Fimages%2F16e359f1-1a55-4c49-b3d1-2d40dfaf9f39_965x610.png)
Why This Foundation Matters
What we’re building today isn’t just a local system—it’s a scaled-down version of the same architectural patterns that power Netflix’s real-time analytics, Uber’s event streaming platform, and Amazon’s CloudWatch logs. Every design decision we make reflects the same trade-offs these companies face at massive scale.
The critical insight here is understanding that distributed systems aren’t about having multiple machines—they’re about designing with distribution principles from day one. When Netflix processes billions of log events daily, they use the exact same event sourcing patterns, message queue semantics, and observability strategies we’ll implement today. The only difference is scale.
By building these patterns locally first, you’ll understand the fundamental challenges: message ordering guarantees, failure recovery, backpressure handling, and data consistency models. These challenges don’t change whether you’re processing 1,000 events per second or 1 million—only your infrastructure capacity changes.
System Design Deep Dive: Core Distributed Patterns
### Event Sourcing and Message Queuing Architecture
Our system implements event sourcing through Kafka, where every log event becomes an immutable fact in our system’s history. This isn’t just message passing—it’s a fundamental shift from request-response to event-driven thinking.
The key trade-off here is consistency versus availability. By using Kafka’s partitioning strategy, we guarantee message ordering within partitions but accept eventual consistency across the system. This is the same decision Uber made for their real-time data platform: they prioritized availability and partition tolerance over immediate consistency, accepting that different services might have slightly different views of the world at any given moment.
Anti-pattern warning: Don’t fall into the trap of using Kafka like a traditional message queue with immediate acknowledgments. The power comes from treating it as a distributed log where consumers can replay events and multiple subscribers can process the same stream independently.
### Cache-Aside Pattern with Redis
We implement cache-aside caching where our API gateway checks Redis first, then falls back to PostgreSQL for cache misses. This pattern handles the classic trade-off between read latency and data freshness.
The architectural insight here is understanding cache invalidation strategies. We use time-based expiration (TTL) for simplicity, but production systems like Amazon’s DynamoDB Accelerator (DAX) implement sophisticated invalidation based on write-through patterns and event triggers.
Scalability bottleneck: Redis becomes a single point of failure in this design. At Netflix scale, this evolves into Redis clusters with consistent hashing, but for our local system, we accept this limitation while building the foundational patterns correctly.
### Circuit Breaker and Bulkhead Patterns
Using Resilience4j, we implement circuit breakers around external service calls and bulkhead patterns to isolate different types of requests. This prevents cascade failures where one slow database query doesn’t bring down your entire log ingestion pipeline.
The trade-off is between system resilience and operational complexity. Circuit breakers add monitoring overhead and require careful tuning, but they’re essential for systems that need to handle partial failures gracefully. This is exactly how Spotify prevents their recommendation service outages from affecting music playback.
### Observable Systems Architecture
We instrument everything with Micrometer metrics and distributed tracing. This isn’t just monitoring—it’s designing for debuggability at scale. Every service exposes health checks, custom metrics, and trace context propagation.
Production consideration: Observability has performance costs. Each metric collection and trace span adds latency. We carefully choose what to measure, focusing on RED metrics (Rate, Errors, Duration) rather than monitoring everything.
### Database Connection Pool Management
Our system uses HikariCP connection pooling with carefully tuned parameters. This addresses the fundamental challenge of database connections as a finite resource that must be shared across concurrent requests.
The key insight is that connection pools are your first line of defense against database overload. The configuration we use (maximum 20 connections, 30-second timeout) reflects production patterns where you’d rather fail fast with connection timeouts than overwhelm your database with too many concurrent queries.
Implementation Walkthrough
### Service Architecture Decisions
We structure our system as three distinct Spring Boot services:
Log Producer Service: Exposes REST endpoints for log ingestion and publishes to Kafka. The architectural decision here is to separate ingestion from processing, allowing us to handle traffic spikes by buffering events in Kafka rather than overwhelming downstream services.
Log Consumer Service: Subscribes to Kafka topics and persists logs to PostgreSQL. We implement idempotent processing using log event IDs, ensuring that message redelivery doesn’t create duplicate records. This reflects the same exactly-once semantics that Apache Flink uses for stream processing.
API Gateway Service: Provides query endpoints with Redis caching. The gateway pattern centralizes cross-cutting concerns like authentication, rate limiting, and response caching. This is the same pattern Amazon uses for API Gateway, though our implementation is obviously simpler.
\[Image placeholder: Service interaction diagram showing request/response flow between services\]
### Message Processing Strategy
We configure Kafka consumers with manual acknowledgment, giving us control over when messages are considered processed. This prevents message loss during service restarts and allows for sophisticated error handling strategies.
The consumer group configuration ensures that multiple consumer instances can process messages in parallel while maintaining ordering guarantees within partitions. This is crucial for scaling—you can add more consumer instances without changing your application code.
### Database Design Philosophy
Our PostgreSQL schema includes proper indexing for time-range queries, which are the most common pattern for log systems. We also implement connection pooling and prepared statements for optimal performance.
Performance insight: We use JSONB for storing log metadata, taking advantage of PostgreSQL’s native JSON indexing. This gives us the flexibility of document storage with the performance of relational queries—exactly the approach Discord uses for storing billions of messages.
Production Considerations
### Performance Optimization
The system includes JVM tuning parameters optimized for throughput over latency. We configure G1GC for consistent performance under varying load conditions. Kafka producers use batching and compression to maximize throughput while minimizing network overhead.
Monitoring strategy: We track JVM metrics, Kafka lag, database connection pool utilization, and Redis hit rates. These four metrics tell you everything you need to know about system health in production.
### Failure Scenarios and Recovery
We implement graceful degradation where Redis failures don’t break the API—queries just become slower as they hit PostgreSQL directly. Kafka failures are handled by Spring Retry with exponential backoff, preventing overwhelming the broker during recovery.
The critical insight is that systems fail in partial ways. Netflix’s chaos engineering approach teaches us to build systems that continue operating even when individual components fail. Our circuit breaker configuration reflects this philosophy.
### Deployment and Scaling Strategies
The Docker Compose configuration includes resource limits and restart policies that reflect production deployment practices. We use health checks to ensure services are genuinely ready before receiving traffic.
Capacity planning: The system is configured to handle approximately 1,000 events per second on standard development hardware. The bottleneck is typically PostgreSQL writes, which is exactly what you’d expect in a log processing system.
Scale Connection: Enterprise Patterns
This exact architecture pattern appears in every major tech company, scaled up with additional infrastructure:
The architectural principles don’t change at scale—only the infrastructure capacity and operational complexity increase.
Next Steps
Tomorrow we’ll break our single-machine constraint and implement TCP-based log collection, introducing network partition handling and service discovery patterns. This builds naturally on today’s foundation by extending our event-driven architecture across machine boundaries.
The key insight you should take from today: distributed systems design isn’t about having multiple machines—it’s about designing with distribution principles that make your system resilient, observable, and scalable from day one.
Youtube Video:
Implementation Guide
====================
### Github Link:
https://github.com/sysdr/sdc-java/tree/main/day7/distributed-log-processor
Setting Up Your Development Environment
Before we start building, let’s make sure you have everything you need installed on your computer.
### Required Software
Java Development Kit 17+
java -version
# Should show version 17 or higher
Maven 3.8+
mvn -version
# Should show version 3.8 or higher
Docker and Docker Compose
docker --version
docker-compose --version
# Both should be installed and running
If you’re missing any of these, install them before continuing. Docker is especially important since it will run our databases and message queues.
Building the Complete System
### Step 1: Generate the Project Structure
Run the system generator script we created:
chmod +x generatesystemfiles.sh
This creates a complete project with three Spring Boot services and all the configuration files we need. You should see a new folder called distributed-log-processor with everything inside.
\[Image placeholder: Terminal screenshot showing successful project generation\]
### Step 2: Start the Infrastructure Services
Navigate to your project folder and start the supporting services:
cd distributed-log-processor
This command starts:
Wait for the setup script to complete. It will check that all services are healthy before finishing.
### Step 3: Build the Java Applications
Now let’s compile our three Spring Boot services:
# Build all services at once
mvn clean package -DskipTests
# This might take a few minutes the first time
# Maven will download all the dependencies we need
You should see “BUILD SUCCESS” for each of the three services: log-producer, log-consumer, and api-gateway.
### Step 4: Start the Services
Open three separate terminal windows and start each service:
Terminal 1 - Log Producer:
cd log-producer
mvn spring-boot:run
Terminal 2 - Log Consumer:
cd log-consumer
mvn spring-boot:run
Terminal 3 - API Gateway:
cd api-gateway
mvn spring-boot:run
Each service will take about 30-60 seconds to start. You’ll know they’re ready when you see “Started \[ServiceName\]Application” in the logs.
\[Image placeholder: Three terminal windows showing services starting up\]
Testing Your System
### Health Check Test
Let’s verify everything is working by checking the health of each service:
# Check Log Producer (port 8081)
curl http://localhost:8081/producer/api/logs/health
# Check Log Consumer (port 8082)
curl http://localhost:8082/actuator/health
# Check API Gateway (port 8080)
curl http://localhost:8080/gateway/api/query/health
Each command should return a JSON response with “status”: “healthy”.
### Send Your First Log Event
Let’s send a log message to our system:
curl -X POST http://localhost:8081/producer/api/logs/ingest \
-H “Content-Type: application/json” \
-d ‘{
“level”: “INFO”,
“message”: “Hello from our distributed log system!”,
“source”: “test-application”,
“metadata”: {
“userId”: “student123”,
“action”: “first_test”
}
}’
You should get back a response like:
{
“status”: “accepted”,
“logId”: “some-unique-id”,
“message”: “Log event successfully ingested”
}
### Query Your Log Back
Wait about 5 seconds for the message to be processed, then query it back:
curl “http://localhost:8080/gateway/api/query/logs?source=test-application”
You should see your log message in the response, along with timestamps and the metadata you sent.
### Run the Full Integration Test
We’ve provided a complete test suite that verifies all the functionality:
This script tests:
All tests should pass with green checkmarks.
Performance Testing
### Load Test
Let’s see how much load our system can handle:
This sends 600 log messages over 60 seconds (10 per second) and measures response times. Watch the terminal output to see how your system performs under load.
### Monitor Performance
While the load test is running, open Grafana in your web browser:
Login with username admin and password admin. You’ll see dashboards showing:
\[Image placeholder: Grafana dashboard showing live metrics during load test\]
Understanding the Data Flow
Let’s trace what happens when you send a log message:
1. HTTP Request → Your curl command sends JSON to the Log Producer
2. Kafka Publishing → Producer converts JSON to Kafka message and sends to log-events topic
3. Message Consumption → Log Consumer receives message from Kafka
4. Database Write → Consumer saves log to PostgreSQL with proper indexing
5. Query Path → API Gateway checks Redis cache first, then PostgreSQL if needed
6. Monitoring → All steps generate metrics that Prometheus collects
### Viewing the Raw Data
You can see your logs directly in the database:
# Connect to PostgreSQL
docker exec -it postgres psql -U loguser -d logprocessor
# Query your logs
SELECT id, level, message, source, timestamp FROM log_events ORDER BY timestamp DESC LIMIT 10;
# Exit the database
\q
### Checking Kafka Topics
You can also see the messages in Kafka:
# List Kafka topics
docker exec -it kafka kafka-topics --bootstrap-server localhost:9092 --list
# See recent messages (press Ctrl+C to stop)
docker exec -it kafka kafka-console-consumer --bootstrap-server localhost:9092 --topic log-events --from-beginning
Exploring Advanced Features
### Circuit Breaker Testing
Let’s trigger the circuit breaker by stopping the database:
# Stop PostgreSQL
docker stop postgres
# Try to send logs - should get circuit breaker response
curl -X POST http://localhost:8081/producer/api/logs/ingest \
-H “Content-Type: application/json” \
-d ‘{”level”: “ERROR”, “message”: “Test during outage”, “source”: “test”}’
# Restart PostgreSQL
docker start postgres
The system should return a “service unavailable” response when the database is down, demonstrating our resilience patterns.
### Cache Performance
Let’s test the cache-aside pattern:
# First query (cache miss) - will be slower
time curl “http://localhost:8080/gateway/api/query/stats”
# Second query (cache hit) - much faster
time curl “http://localhost:8080/gateway/api/query/stats”
The second request should be noticeably faster because it’s served from Redis.
### Batch Processing
Test sending multiple logs at once:
curl -X POST http://localhost:8081/producer/api/logs/batch \
-H “Content-Type: application/json” \
-d ‘[
{”level”: “INFO”, “message”: “Batch message 1”, “source”: “batch-test”},
{”level”: “WARN”, “message”: “Batch message 2”, “source”: “batch-test”},
{”level”: “ERROR”, “message”: “Batch message 3”, “source”: “batch-test”}
]’
This is much more efficient than sending logs one at a time.
Monitoring and Debugging
### Key Metrics to Watch
In Grafana, focus on these important metrics:
Throughput Metrics:
logingestiontotal - How many logs per second we’re processingkafkamessagessent_total - Messages successfully sent to Kafkakafkamessagesconsumed_total - Messages processed by consumersPerformance Metrics:
logingestionduration - How long it takes to process each loghttpserverrequests - API response timeslogprocessingduration - Consumer processing timeHealth Metrics:
### Common Issues and Solutions
“Connection refused” errors: Make sure Docker containers are running with docker-compose ps
Slow queries: Check the database connection pool isn’t exhausted in the metrics
High memory usage: Monitor JVM heap size and consider increasing it with -Xmx4g
Kafka lag: If consumers fall behind, increase the number of consumer instances
Real-World Applications
The system you’ve built demonstrates the same patterns used by:
Netflix: Their event streaming processes billions of user interactions daily using identical Kafka partitioning and consumer group patterns.
Uber: Their dispatch system uses the same circuit breaker patterns to handle partial failures across thousands of services.
Discord: Their message storage uses PostgreSQL with JSONB for metadata, just like our log system.
Amazon CloudWatch: Uses cache-aside patterns with Redis for high-performance log queries.
The only differences at scale are:
But the fundamental architectural patterns remain the same.
\[Image placeholder: Comparison diagram showing local system vs enterprise scale\]
What You’ve Accomplished
Congratulations! You’ve built a production-ready distributed log processing system that includes:
This foundation prepares you for tomorrow’s lesson where we’ll extend this system across network boundaries, introducing service discovery and network partition handling.
The most important lesson: distributed systems aren’t about having multiple machines—they’re about designing with distribution principles that make systems resilient, observable, and scalable from the start.
Cleanup
When you’re done experimenting, stop all services:
# Stop Spring Boot services (Ctrl+C in each terminal)
# Stop Docker infrastructure
docker-compose down
# Remove volumes if you want to start fresh next time
docker-compose down -v
This frees up system resources and stops all the background processes.
You can include dynamic values by using placeholders like: https://drewdru.syndichain.com/articles/e9f4a4e4-2267-4df4-9b7e-64b609bf9629 , Drew Dru, https://sdcourse.substack.com/p/day-7-building-your-first-end-to , drewdru, drewdru, drewdru, drewdru These will automatically be replaced with the actual data when the message is sent.